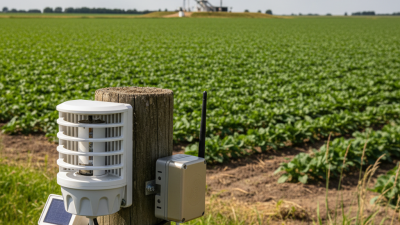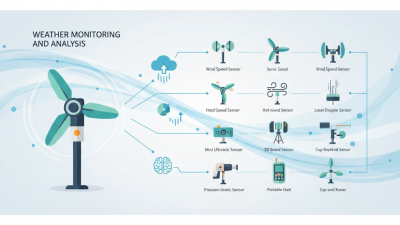
A Temperature And Humidity Sensor measures two environmental conditions that influence comfort, equipment, crops, and stored materials. Temperature describes how warm or cold the surrounding air is. Humidity indicates how much water vapor the air contains. Together, these readings provide a clearer view of indoor and outdoor conditions than either measurement alone.
Inside a greenhouse, a sensor can reveal dry air near a heater or excessive moisture beneath leaves. In a server room, it may warn of heat buildup before equipment becomes unstable. Homes, laboratories, warehouses, and museums also depend on these measurements. Small changes matter. A few degrees or a sudden humidity spike can affect product quality, energy use, or human comfort.
Reliable results depend on more than the sensor itself. Placement, calibration, airflow, condensation, and maintenance can change the readings. A device mounted beside a window may report sunlight rather than average room conditions. That mistake is easy to miss. Professional users compare readings with trusted reference instruments and review data over time. Specifications should also be checked carefully, including accuracy, response time, operating range, and communication method.
The technology is useful, but not magical. Sensors can drift. Cheap models may perform poorly in harsh environments. This is why practical testing remains important before relying on automated alerts or control systems. Understanding how a Temperature And Humidity Sensor works helps users choose suitable equipment, interpret measurements responsibly, and recognize when the data needs closer examination.
What Is a Temperature and Humidity Sensor?
A temperature and humidity sensor measures air temperature and relative humidity. Relative humidity is expressed from 0–100% RH. It describes how much water vapor exists compared with the maximum air can hold at the same temperature. The World Meteorological Organization’s Guide to Instruments and Methods of Observation treats humidity as a measurement requiring controlled calibration and careful placement. Location matters. A sensor near a window may report sunlight, not room conditions.
Temperature usually appears in Celsius or Fahrenheit. The conversion is simple: °F = (°C × 9/5) + 32. For example, 25°C equals 77°F. However, the displayed range is not the same as guaranteed accuracy. Many sensors list broad operating limits, while their best accuracy appears near normal indoor conditions. That difference is easy to miss.
ASHRAE technical guidance commonly evaluates indoor comfort around moderate temperatures and relative humidity, rather than at the full 0–100% RH span. At 100% RH, condensation can form on cooler surfaces. At very low humidity, readings may drift or become unstable. ISO 7726 also emphasizes sensor response, placement, and environmental influences. I have seen installation errors create bigger problems than the sensing element itself. A shaded, ventilated position usually produces more useful data. Still, no sensor is perfect. Calibration certificates, response time, and stated uncertainty deserve attention before trusting a single number.
What Is a Temperature and Humidity Sensor?
How Sensors Work: Thermistors, RTDs, Capacitive RH, and Digital Chips
A temperature and humidity sensor measures heat and moisture in surrounding air. Its accuracy depends on sensing technology, placement, airflow, and calibration. In practical installations, a sensor near a warm wall may report higher temperatures than the room center. Small details matter.
Thermistors change resistance as temperature changes. They respond quickly and usually cost less, but their output is nonlinear. RTDs also measure resistance, using a stable metal element for better accuracy and repeatability. They often perform well in laboratories and industrial equipment, although wiring resistance can affect readings. Careful installation is essential.
Capacitive RH sensors detect moisture by measuring changes in electrical capacitance. Dust, condensation, and chemical exposure can gradually reduce their reliability. Digital chips combine sensing elements, signal processing, and temperature compensation in one compact package. They provide convenient data, but software cannot repair poor placement or damaged hardware.
Readings still need judgment. Field testing may reveal differences between two sensors in the same room. The cause could be airflow, self-heating, or calibration drift. I sometimes question an unusually stable reading, because real rooms rarely remain perfectly steady. A useful measurement includes the sensor, its environment, and its maintenance record.
Typical absolute accuracy varies by sensing technology. Thermistors and RTDs measure temperature, while capacitive RH elements measure relative humidity. Digital sensor chips commonly integrate both functions.
Lower values indicate smaller typical measurement error. Representative values are approximate and depend on calibration, operating temperature, response time, and sensor construction.
What Is a Temperature and Humidity Sensor?
A temperature and humidity sensor measures air temperature and water vapor together. The temperature channel commonly uses a calibrated resistance or semiconductor element. Relative humidity is estimated through a moisture-sensitive polymer. In typical devices, practical accuracy benchmarks are ±0.3°C for temperature and ±2% RH for humidity. These figures usually apply near 25°C and 50% RH, under stable laboratory conditions. They are not guarantees for every room.
Professional measurement guidance demands more context. ISO 7726:1998 specifies performance requirements for instruments used in thermal environments, including accuracy, response, and placement considerations. The World Meteorological Organization’s Guide to Instruments and Methods of Observation, WMO-No. 8, stresses traceable calibration and documented uncertainty. These references show why a sensor’s data sheet should state test conditions. Resolution is not accuracy. A display showing 0.1°C may still be wrong by 0.5°C.
Field experience is less tidy. A sensor beside a window can read cooler than room air. Warm circuit boards may raise local temperature. Steam, dust, condensation, and slow airflow can distort RH readings. A ±2% RH result may become unreliable near saturation or during rapid changes. Calibration checks at two points are useful, though not always convenient. One uncomfortable question remains: are we measuring the room, or merely the sensor’s small pocket of air? That distinction deserves attention before using readings for storage, comfort, or process control.
What Is a Temperature and Humidity Sensor?
A temperature and humidity sensor measures air conditions and converts them into readable electrical data. Its value depends on more than accuracy alone. Response time shows how quickly the sensor follows a changing environment. A fast response helps in airflow tests, while a slower response may suit stable storage areas. Mounting matters. A sensor placed inside a protective cover often reacts later than one exposed to moving air.
Operating limits define the temperatures and humidity levels the device can safely measure. Exceeding these limits may cause temporary errors or permanent damage. Drift is another concern. Readings can slowly change as the sensing material ages or faces dust, condensation, and repeated heat cycles. In field checks, I compare readings after long use, not only during installation. A clean specification sheet is not enough. Real conditions are less polite.
Tips: Allow the sensor to reach thermal equilibrium before recording data. Keep it away from direct sunlight, vents, and wet surfaces. Check response time under realistic airflow, because laboratory values may not match installation results. Plan calibration at regular intervals, especially when measurements affect storage quality or process control. Calibration should use a traceable reference and documented conditions. Even then, uncertainty remains. That part is easy to overlook. Record the date, reference value, ambient conditions, and observed deviation. If drift becomes consistent, adjust the maintenance interval rather than ignoring the pattern.
| Specification | Typical Data or Range | What It Means | Important Practical Notes |
|---|---|---|---|
| Measured Parameters | Temperature and relative humidity (RH) | The sensor measures air temperature and the amount of water vapor relative to the maximum possible moisture at that temperature. | Relative humidity is temperature-dependent; dew point or absolute humidity may be calculated from both measurements. |
| Temperature Sensing Element | Semiconductor bandgap, resistance-based element, or thermistor | Converts temperature changes into an electrical signal. | Thermistors can provide high sensitivity but generally require signal linearization. |
| Humidity Sensing Element | Capacitive polymer film | Changes capacitance as water molecules are absorbed by the sensing layer. | Capacitive sensors are widely used because they require low power and can be integrated with digital compensation. |
| Temperature Operating Range | −40 to 125 °C | The ambient temperature range in which the sensor can operate within its specified limits. | The guaranteed accuracy range may be narrower than the electrical operating range. |
| Humidity Operating Range | 0 to 100% RH, non-condensing | The usable relative-humidity range under conditions where liquid water is not continuously present on the sensing element. | Condensation can temporarily slow the response and may cause offset, contamination, or permanent damage. |
| Temperature Accuracy | Typically ±0.2 to ±0.5 °C at 25 °C | The maximum expected difference between the reported and reference temperature under stated test conditions. | Accuracy usually changes with temperature, supply voltage, airflow, and self-heating. |
| Humidity Accuracy | Typically ±2 to ±5% RH from 20 to 80% RH | The expected difference between the reported and reference relative humidity within the stated measurement region. | Accuracy often decreases near 0% RH and 100% RH and at temperature extremes. |
| Response Time, Temperature | Approximately 5 to 30 seconds, typical t63 | The time required to reach about 63% of the final reading after a step change in temperature. | A protective enclosure, low airflow, or a large package usually increases response time. |
| Response Time, Humidity | Approximately 5 to 60 seconds, typical t63 | The time required for the RH reading to reach about 63% of its final value after a humidity step. | Response time is strongly affected by airflow, filter membranes, enclosure design, and condensation. |
| Resolution | Temperature: 0.01 to 0.1 °C; RH: 0.01 to 0.1% RH | The smallest digital increment shown by the measurement system. | Resolution is not the same as accuracy; a highly resolved reading can still contain measurement error. |
| Long-Term Drift | Temperature: typically less than ±0.1 °C/year; RH: typically ±0.5 to ±1.0% RH/year | The gradual change in sensor output when the actual environmental conditions remain stable. | Chemical exposure, dust, high humidity, heat, and repeated condensation can accelerate drift. |
| Humidity Hysteresis | Typically less than 1% RH | The difference in output at the same humidity depending on whether humidity was reached by increasing or decreasing RH. | Hysteresis is commonly higher after condensation or prolonged exposure to very high humidity. |
| Calibration Method | Two-point calibration using traceable temperature and humidity references | Calibration compares the sensor with known reference conditions and applies a correction. | Common humidity references include saturated salt solutions or controlled humidity chambers. |
| Recommended Calibration Interval | Every 12 to 24 months, or according to risk assessment | The suggested period between verification or recalibration activities. | Shorten the interval for regulated processes, harsh environments, or applications requiring low measurement uncertainty. |
| Condensation Limit | Avoid continuous liquid-water exposure | Defines a practical operating boundary for sensors intended for non-condensing environments. | Use a suitable protective membrane, drainage path, or heated enclosure when condensation cannot be avoided. |
| Typical Supply Voltage | 1.8 to 5.5 V DC | The DC voltage range used to power many integrated digital sensors. | Verify voltage tolerance and logic levels before connecting the sensor to a controller. |
| Common Digital Interfaces | I²C or single-wire digital output | Provides processed temperature and RH values to a microcontroller or data logger. | Check address configuration, pull-up requirements, cable length, and communication speed. |
A temperature and humidity sensor measures two basic properties of indoor air: thermal condition and moisture content. In HVAC systems, these readings guide ventilation, cooling, heating, and dehumidification. The stakes are practical. The 2023 Global Status Report for Buildings and Construction estimates that buildings consume about 30% of global final energy. Poor sensor placement can waste energy while leaving occupants uncomfortable.
ISO 7726 provides methods for measuring physical quantities in thermal environments. It addresses air temperature, humidity, air speed, and radiant temperature. A sensor near a supply vent may report artificially cold air. A device beside a window may read excessive solar heat. In field commissioning, technicians should check exposure, response time, calibration history, and maintenance access. Small errors matter. Comfort is not measured by temperature alone.
IoT networks extend these measurements across offices, factories, museums, and weather stations. Data can reveal a damp corridor at 3 a.m. or rising heat inside a server room. However, more data does not guarantee better decisions. WMO-No. 8 stresses consistent observation methods, instrument siting, traceability, and quality control. These principles support reliable environmental records. The WMO State of the Global Climate 2023 report recorded 2023 as the warmest year in its assessment, showing why dependable observations matter. I still find sensor networks imperfect: wireless delays, drift, condensation, and careless installation can distort a clean-looking dashboard. Celsius is simple. Interpretation is not.